
In the previous blog post we had a look at how we can dockerize our application with Prometheus “plumbing” that will enable us to retrieve metrics from our application. After completing the steps, we were able to retrieve the metrics from our application running inside a container via a web browser. This was yet another step in the process of retrieving metrics from our application in an automated way.
That said, up and until now we had to retrieve metrics by means of targeting a specific port on a URL by hand. Should the URL / port differ we need to be aware of this. So how can this be delegated and done for us in an automated manner?
The answer here first and foremost lies with fact that we will (and should not) be managing (start/stop/ restart) our containers by hand. We should rather delegate this to a container orchestrator that will handle this on our behalf of us. We will use Kubernetes for this.
This begs the next question: How will we tell Kubernetes to retrieve metrics from our application? To answer this we inevitably need to touch on some Kubernetes terminology.
Kubernetes does not run containers “directly”. It rather wraps them in another layer of abstraction called a pod. A pod is the smallest fundamental building block that you as a user can interact with within Kubernetes.
It consists of 1 or more containers that will always be deployed together.
Containers in pods have:
- Shared IP space.
- Shared volumes.
- Shared scaling (you scale pods, not the individual containers).
The following mapping may be helpful to visualize the layers involved.
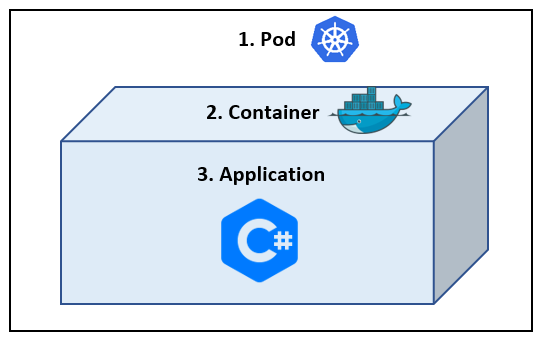
So we have the following:
- The Pod – this will be run by Kubernetes.
- The Docker container – this contains our application.
- Our application.
Configuring and using points 2 and 3 were already covered in the previous blogs. Point 1 (the pod) also requires a once-off configuration. The different pod configurations that are at your disposal are extensive and fall beyond the scope of this post. We will, however, zoom in on the configuration sections required for Prometheus.
Within your pod configuration file you should add the following Annotations:
- prometheus.io/port=1234
- prometheus.io/scrape=true
example of the annotations:

The annotation sections above (in red) tell Kubernetes that this pod requires scraping and on which port.
- Pretty obvious, but this is primarily done by the scrape=true
- The port= refers to the endpoint port that you exposed. If you exposed a different port on your container than the default port, you will need to specify this explicitly. In this example it was indeed the case, hence the reason specifying port 1234.
How does it work in practice?
So Kubernetes is now able to determine that this pod requires scraping, but how will Prometheus know when to jump into action?
On a predefined interval, Prometheus will ask the Kubernetes API server which pods need to be scraped. The fancy word for this is “Service Discovery”.
So Kubernetes is now able to determine that this pod requires scraping, but how will Prometheus know when to jump into action?
On a predefined interval, Prometheus will ask the Kubernetes API server which pods need to be scraped. The fancy word for this is “Service Discovery”.
Example:
Again let’s assume that you already have 1 pod running, with the correct annotation as described above. It should thus be merrily scraped by Prometheus for metrics. BUT … you now choose to upscale your application and tell Kubernetes to start another pod of the same kind. At the next “Service Discovery” run by Prometheus, it will be notified by the Kubernetes API server that your second pod needs to be scraped for metrics. As you can see there is no human interaction required!
Again let’s assume that you already have 1 pod running, with the correct annotation as described above. It should thus be merrily scraped by Prometheus for metrics. BUT … you now choose to upscale your application and tell Kubernetes to start another pod of the same kind. At the next “Service Discovery” run by Prometheus, it will be notified by the Kubernetes API server that your second pod needs to be scraped for metrics. As you can see there is no human interaction required!
